Ed Wiebe
at the UVic Climate Lab
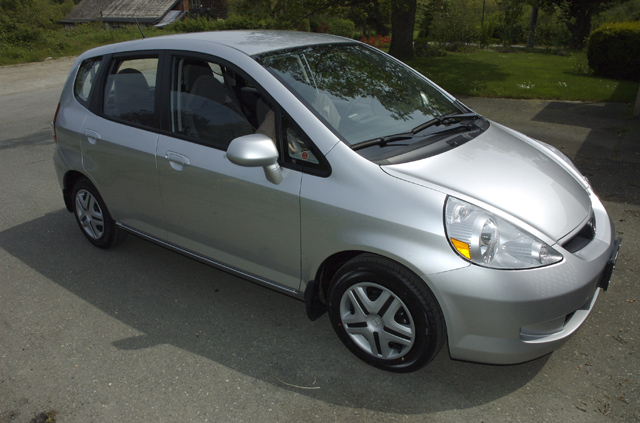
2007 Honda Fit Real World Fuel Efficiency
Some call this Fuel Economy or Gas Mileage
Jump to a spreadsheet where you can determine how much you're not saving by driving farther for cheaper gas.
This page details our record of fuel use for this car. We really like the Fit. You can carry eight foot 2x6 lumber in the car! We are hoping to get a roof rack for a canoe but haven't yet decided whether to get the clamp on style, which many people recommend against, or the through the roof style which leaves small permanent anchor points on the roof.
The official efficiency ratings (l/100 km) for the 2007 Honda Fit are:
  City    Highway
  7.3       5.8
My Observations
========================================================================
     Total fuel consumed =  10296.7   litres
      Total cost of fuel =  12076.95  dollars
  Maximum fuel price was =      1.489 dollars/litre on 2008-07-18
  Minimum fuel price was =      0.819 dollars/litre on 2008-12-18
     Maximum Fill Volume =     41.141 litres
     Minimum Fill Volume =      4.368 litres
        Mean Fill Volume =     28.602 litres
Total distance travelled = 150476     kilometres
      Total CO2 produced =  23700     kg (6450 kg Carbon)
   CO2 offsets purchased = -10000     kg
    CO2 per km travelled =      0.16  kg/km
         Mean efficiency =      6.84  l/100km
   Mean fuel cost per km =      8.0   cents/km
    Purchase cost per km =     13.5   cents/km
 Maintenance cost per km =      3.7   cents/km
   Insurance cost per km =      7.3   cents/km
   Operating cost per km =     32.6   cents/km

BC Carbon Tax Summary
         Dates            Tanks    Rate      Volume      Tax   Distance
                                 (cents/l)     (l)       ($)     (km)
 2008-07-01 to 2009-07-01   43     2.34     1230.80     28.80    16512
 2009-07-01 to 2010-01-01   19     3.51      529.76     18.59     7796
 2010-01-01 to 2010-07-01   19     3.33      505.64     16.84     7473
 2010-07-01 to 2011-07-01   40     4.45     1005.45     44.74    14636
 2011-07-01 to 2012-07-01   31     5.56      921.04     51.21    13358
 2012-07-01 to 2018-04-01  140     6.67     4018.24    268.02    60390
 2018-04-01 to 2019-04-01    1     7.78       21.41      1.67      428
 Totals                                     8232.34    429.87   120593
Climate Action Dividend = $ 400.00
    Net Carbon Tax Paid = $  29.87
=======================================================================
We received an initial payout of $400 (called the Climate Action Dividend) for our family of four and our income tax has also been reduced.
The income tax reduction is not included here but obviously is contributing to further benefits for us. In general people seem to have very little understanding of how this excellent programme works. I hope a few numbers from a real world example will help people understand. Only those who burn a lot of fuel are being punished by the tax and for them it is great incentive to reduce their fuel use (and carbon emissions!).
A further caveat in this analysis is that I have not included the fuel oil we had to buy for the (1970s era) oil burning furnace that was installed in our house when we bought it. We only spent one winter and a fall with that furnace before we managed to arrange to remove it and replace it with an electric air source heat pump. I have not included the carbon tax that we paid on the fuel oil but it was probably about $20 or so. I don't have good records of the fuel oil we bought ... on the other hand it was partially (5% apparently) "bio" sourced oil so that part was carbon-neutral.
With regard to the maintenance, we have done what the car has told us to do by way of the dashboard maintenance codes. Insurance on a modest car that is still reasonably new is about $1000 per year here in BC for drivers with the maximum discount of about 40%. Obviously, the per kilometre purchase cost will continue to fall and the other costs will rise (somewhat).
I thought it might be appropriate to add a bit more information about how I typically commute to and from work. For the past eleven years or so I have used three different bicycles to commute. The commute is about five kilometres each way. I ride rain or shine and even in snow (but ice is bad news -- when icy I have walked or run or driven the car). Luckily ice and snow are rare here in Greater Victoria. Eleven years of commuting this way amounts to about 27 500 km by bicycle. Given that my car produces 0.16 kg/km of CO2, using my bike instead has prevented the emission of about 4400 kg of carbon dioxide. I've also saved about $2200 on gasoline. If I didn't have the car at all I could estimate how much money I saved by bicycle commuting by using the per kilometre operating cost (shown in the table above). Using 34 cents per kilometre amounts to ∼ $10 000 that I wouldn't have had to spend on car ownership over the past ten years.
Bicycles certainly have some emissions cost associated with their production and delivery but that's much less than similar costs for a car. I would have only used two bicycles over this time but one of mine was stolen and had to be replaced. Some people (many?) go through a similiar changeover in new cars over ten years. Yes, I had a different car for the first part of the last decade, but it was very similar in efficiency (old, broken page here).
Have you ever thought about the relationship between your car's mass and its fuel efficiency? Rhett Allain has.
What About Electric Cars?
[2015-11-16] Cradle to Grave costs of Electric cars from the Union of Concerned Scientists. "By the end of their lives, gas-powered cars spew out almost twice as much global warming pollution than the equivalent electric car. Disposing of both types of vehicles (excluding reusing or recycling their batteries) produces less than a ton each."
[2015-03-18] The real cost of electric cars is discussed at Skeptical Science in an essay called "Fossil fuels are way more expensive than you think".
[2015-03-01 This section will need updating soon. It is getting increasingly out of date].
The idea that electric cars are somehow automatically better than those powered by internal combustion is wrong. Electric cars have manufacturing costs (in terms of carbon emissions) that must be taken into account. Electricity production has similar, more obvious, carbon costs. Many people have been looking into this question and it's not settled yet. In a recent article about the Tesla Model S you can read about some of the issues such as battery production and generation techonlogy used for the electric grid. It seems to me that electric cars are the future. There are still problems to resolve but as the proportion of energy from renewable sources increases in the electric grid, as battery technology improves, as the rest of our economies move away from carbon emitting energy sources, the electric car will become increasingly the only way that cars are manufactured. In the meantime it looks like the most fuel efficient carbon fueled vehicles are comparable to the current models of electric vehicles. In all cases it's best to use human power as much as possible to get around.
Here's another discussion of electric vehicles. The question in this case is what is the cost and efficiency of converting the entire USA fleet (of cars) to electric drive? The conclusion is that it would be an expensive way to reduce overall CO2 emissions.

[2015-03-17 New] Download a spreadsheet to see how much you will save by driving farther for less expensive fuel. Hint: not very much. Yes, fuel costs 8.1 cents per km for my car. See below for more details. If you really do this right you need to allow for the real cost per kilometre which in my case is 34 cents/kilometre.
- OS X Numbers: file
NEW: How Much Am I Affecting the Climate System?
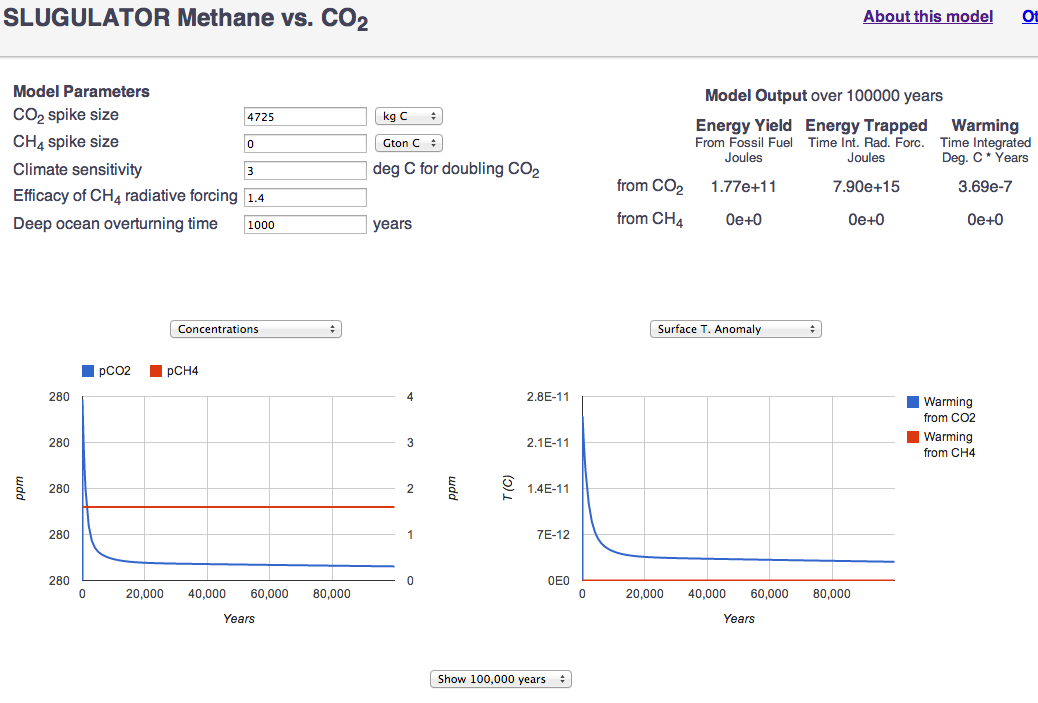
A lot. Click the image at right to see the model output.
The carbon I'm emitting by burning fossil fuels has a large relative impact on the climate system because some of it will stick around for many thousands of years. Using David Archer's SLUGULATOR model you can work out the long term effect of a slug of carbon in the environment. Because some of any initial slug remains in the system for many thousands of years the long-term effect is very large. How large? Similar to five seconds worth of solar energy at the top of the Earth's atmopshere or the energy released through nuclear fission of 90 kg of Uranium-235.
Figures
Fuel Use Versus Distance Travelled
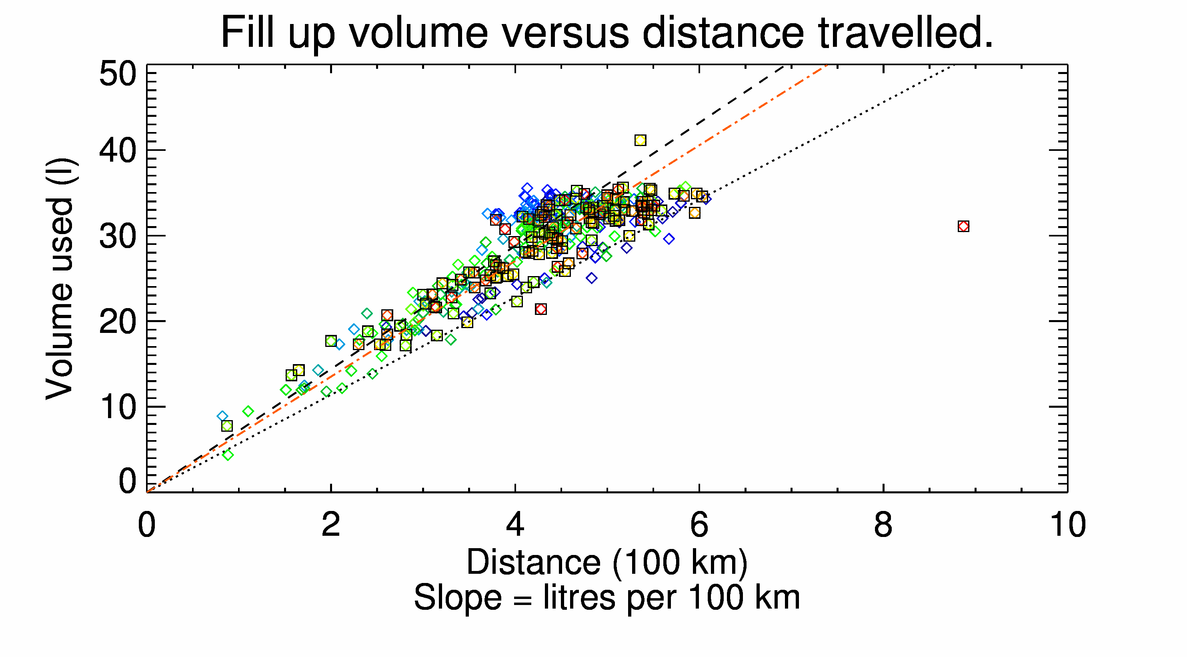
Colours indicate the order of the fill-ups. Red is most recent and blue is oldest. The ROYGBIV rainbow order is followed (approximately). The lines show the official efficiency ratings: dashed is city travel and dotted is highway travel. Ideally we would want to see all of the observations between or below these lines. The red dash-dotted line is the best fit to the data assuming that the line goes through the origin -- it must, you don't use any fuel if you don't drive any distance. It seems pretty clear that if we could isolate the observations related solely to city driving the slope would be steeper (worse) than the official rating. Is this related to driving style? The car is driven by two different drivers. That variable is rolled up in the observations as well.
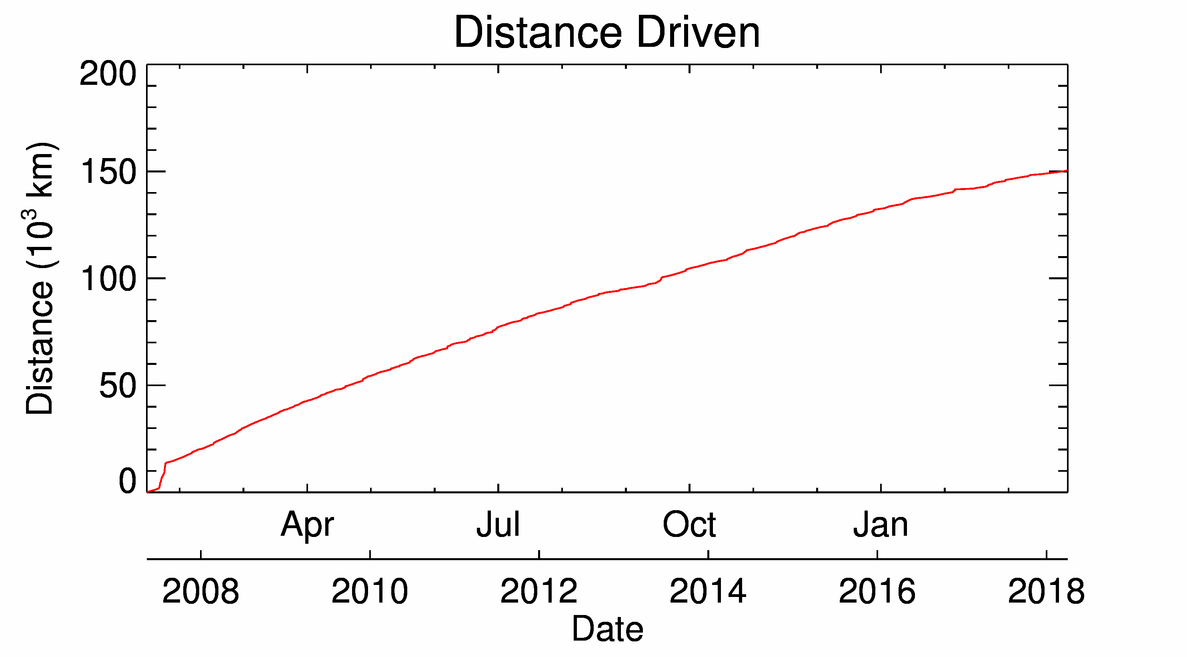
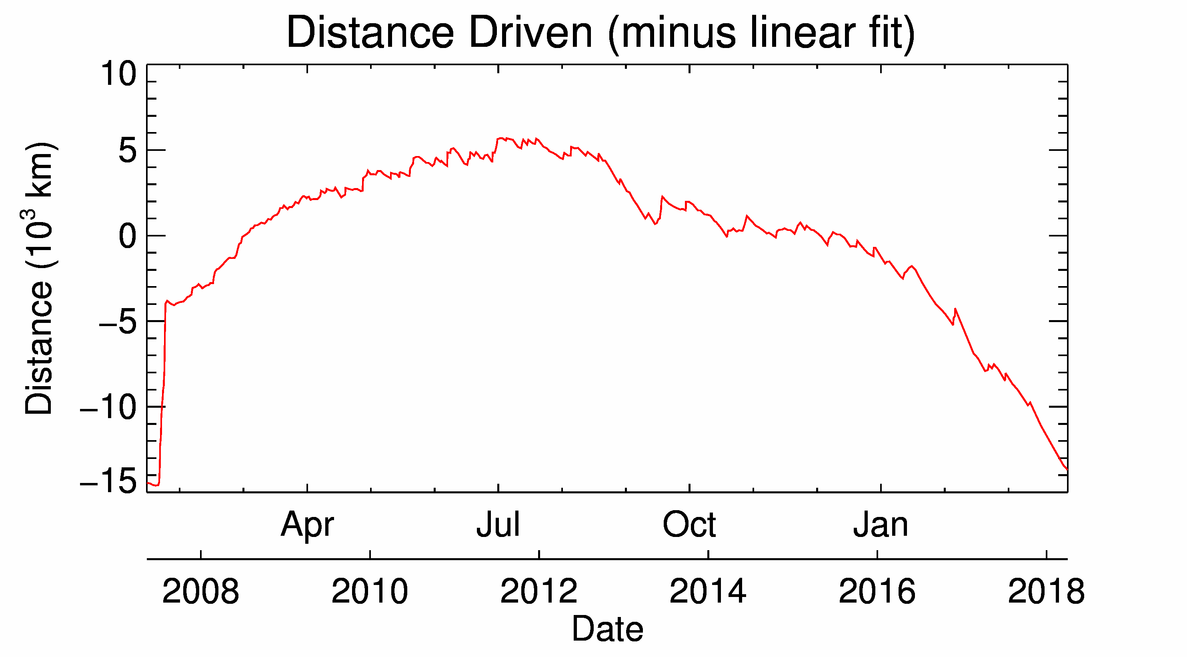
Distance Travelled
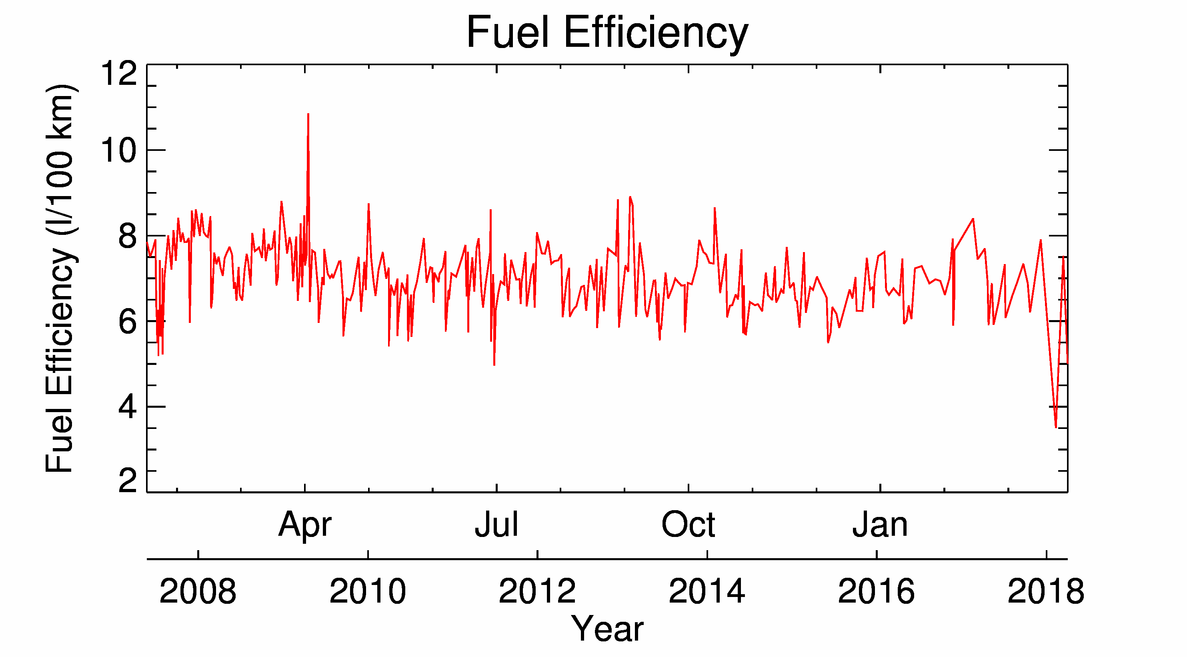
Fuel Efficiency as a function of date
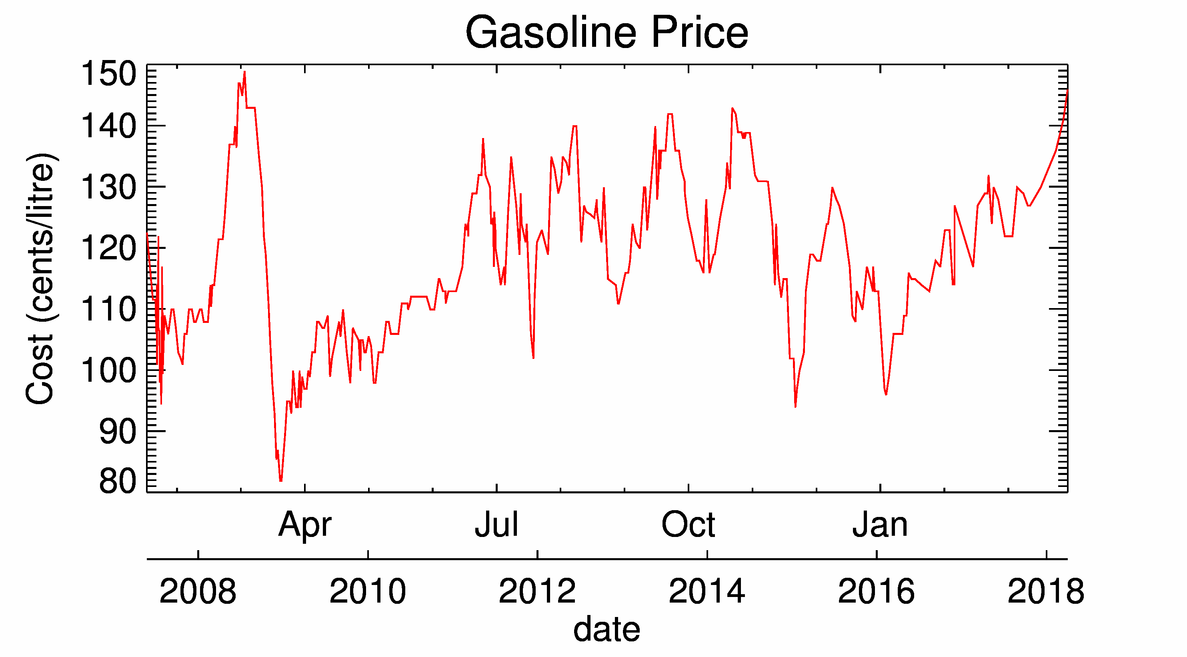
Gasoline Price
See my page showing a longer record of gasoline cost.
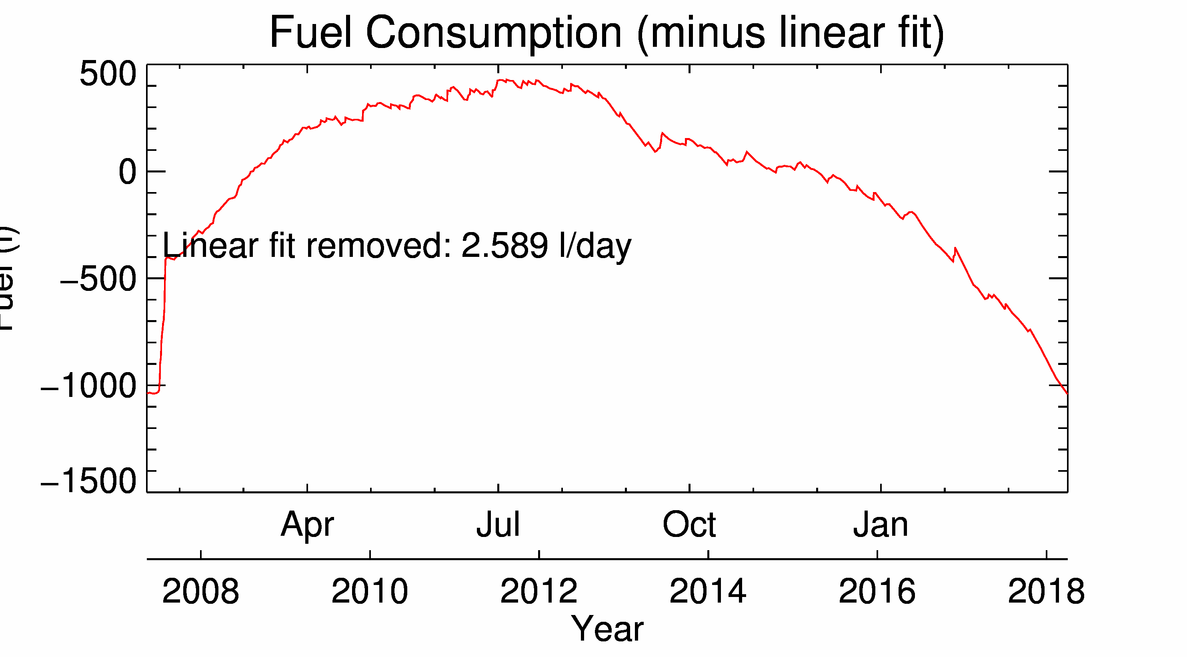
Cumulative fuel consumption
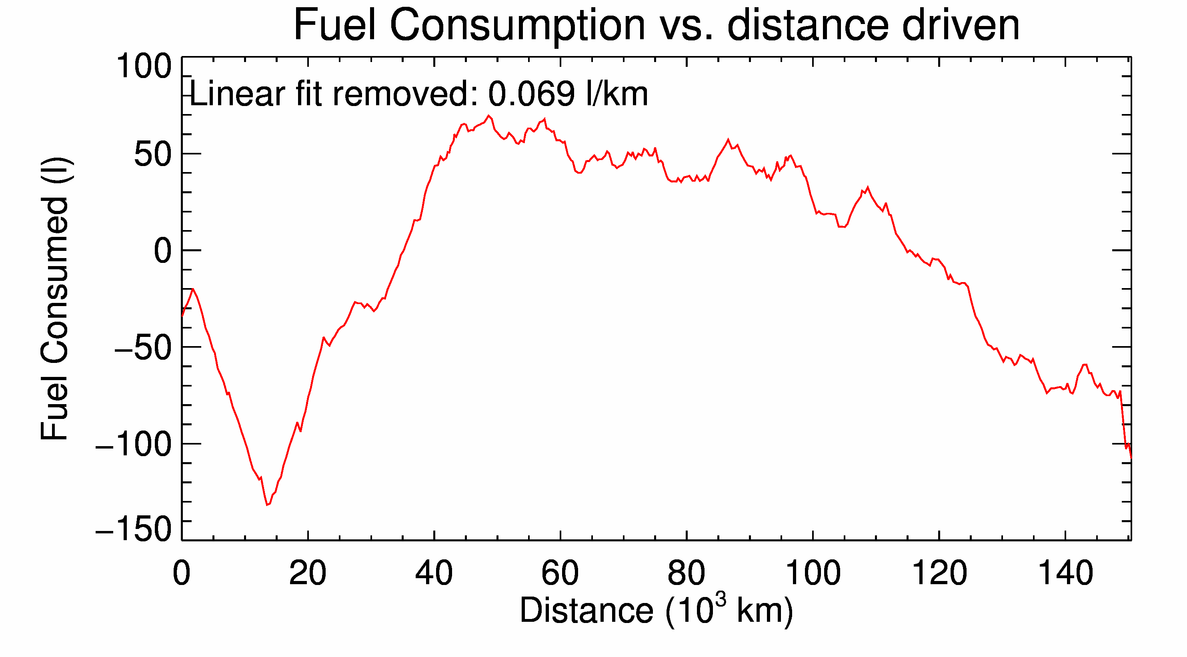
Fuel consumption vs. Distance driven
What do the "GasPods" do?
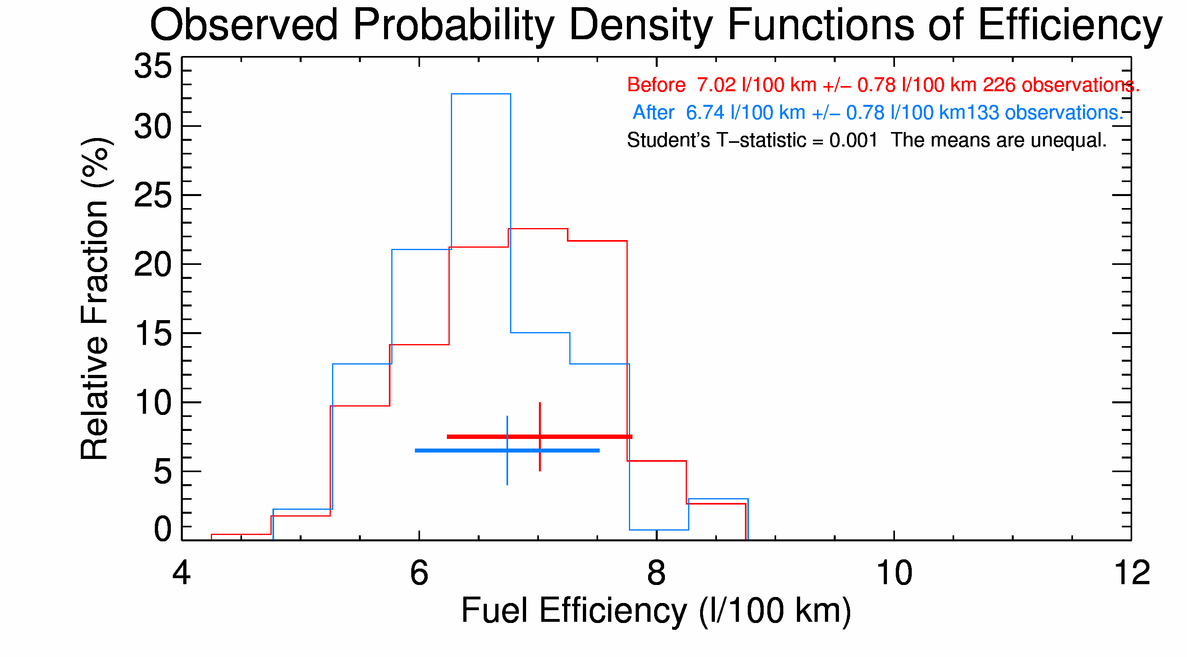
When I heard about "GasPods" I didn't believe they could really have a significant effect. Since belief that something happens doesn't actually help you know it happens I bought a set and am doing my own test of their efficacy.
[Update 2015-06-24 The simple statistical test I am doing now shows that the means of the two pools of observations are most-likely not equal. I find this surprising but there you have it. This simple case does seem to support the claims of the GasPod designers.]

Gasoline Prices since 1998 in Western Canada
Old car page -- 1985 Honda Wagovan and 2001 and Honda Civic Coupe
Keywords:
gas, gasoline, petrol, price, cost, canada, british columbia, bc, victoria, vancouver island, carbon, carbon tax, climate, climate change